Fulltrace Studio
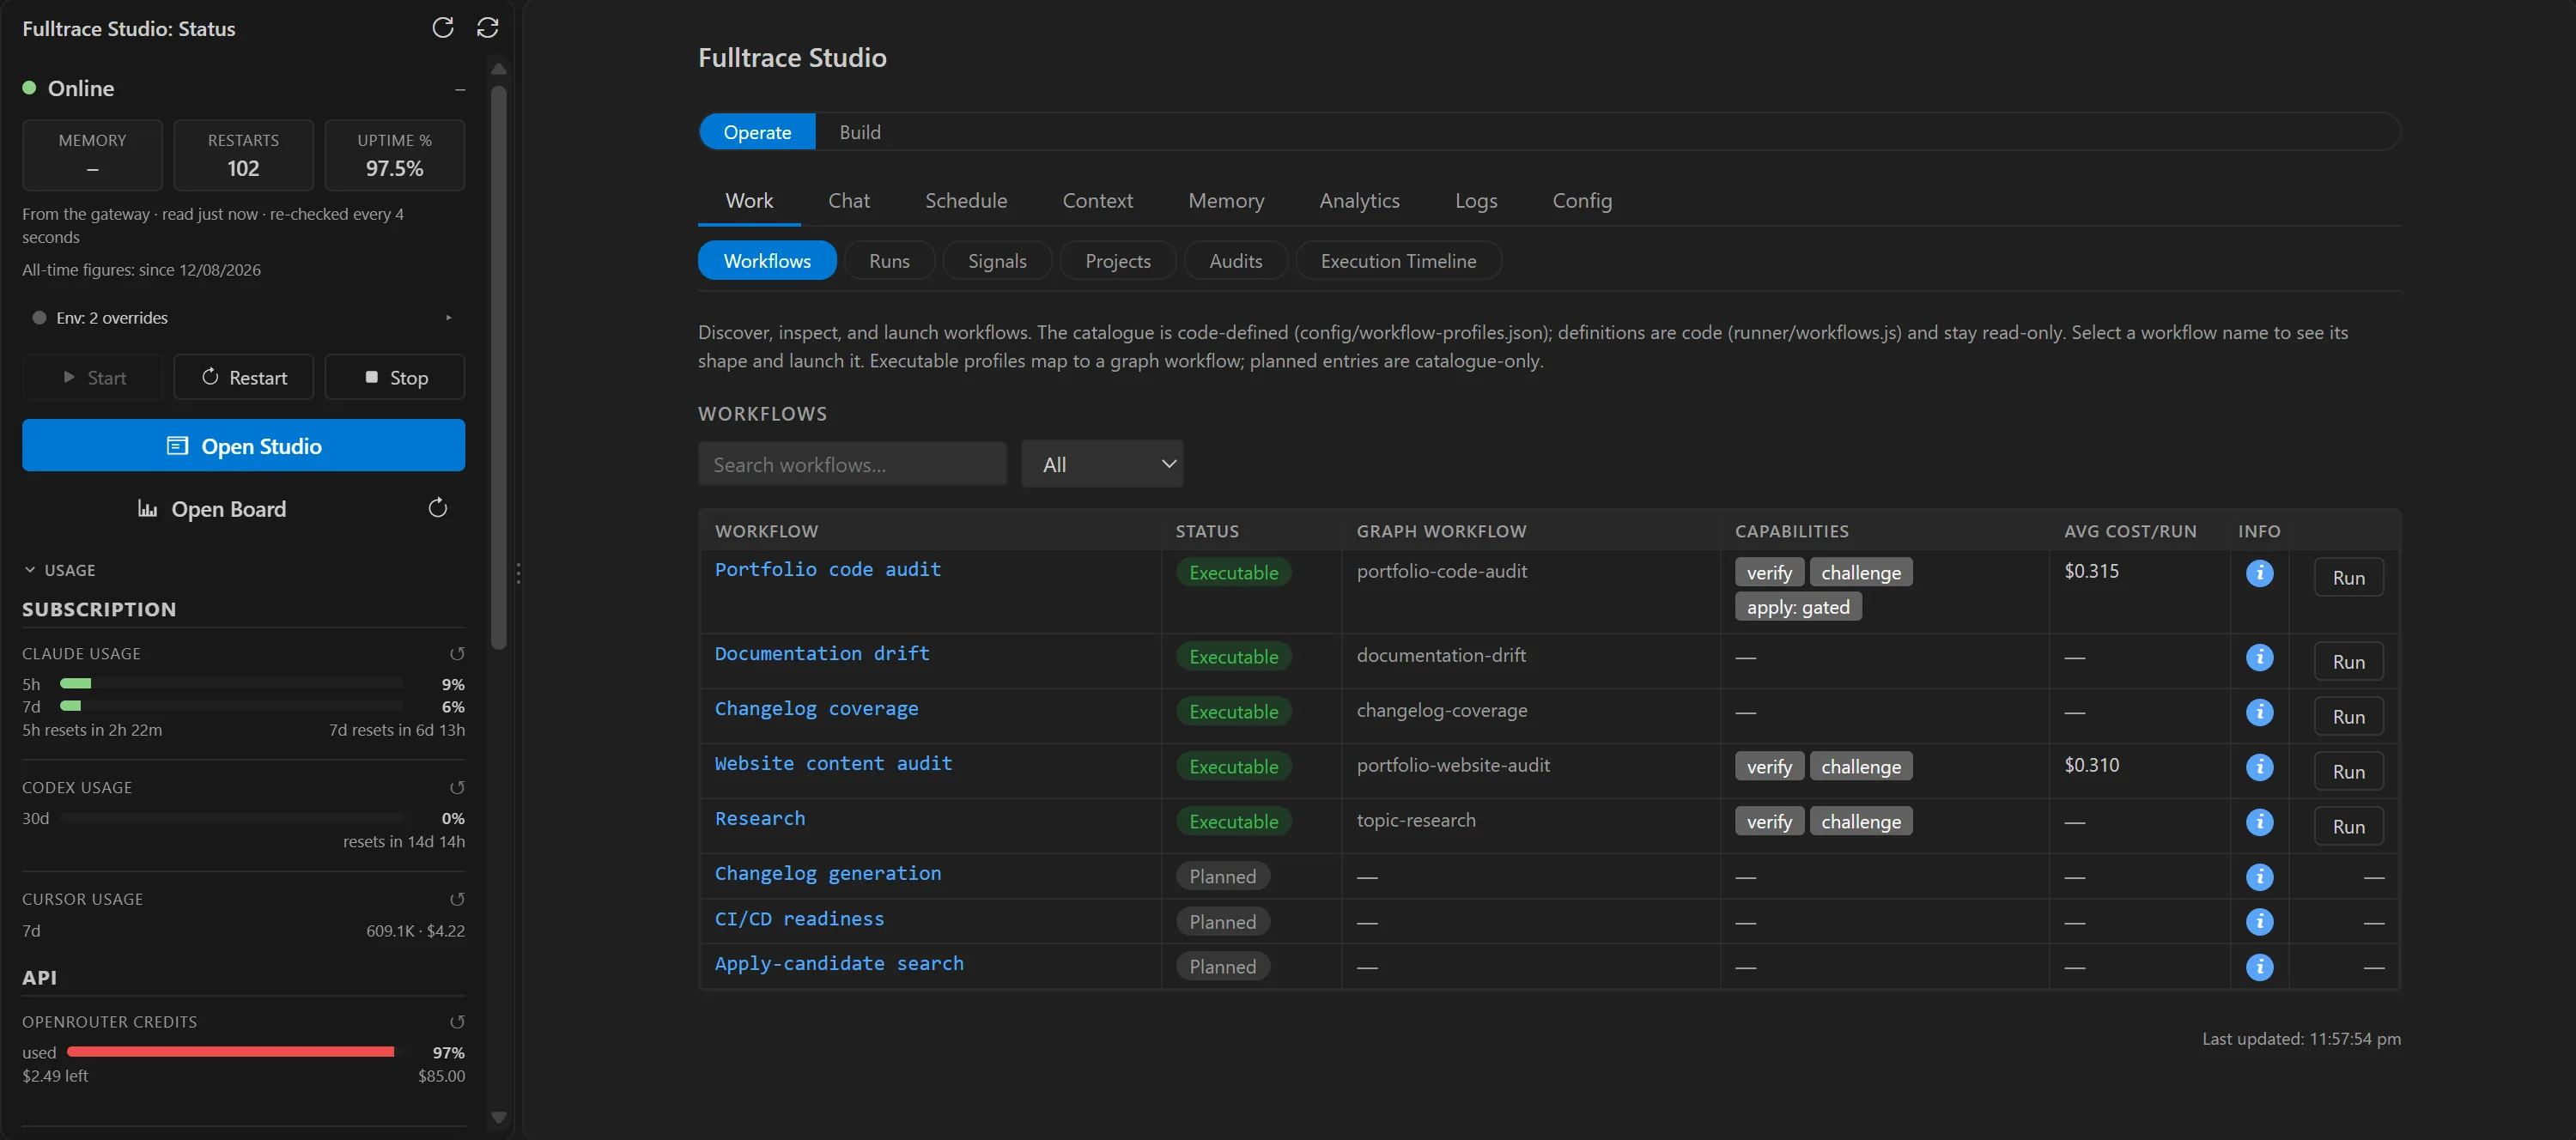
The window onto Fulltrace, built into my code editor: a VSCode extension that shows everything the system is doing without leaving it. A sidebar gives status at a glance. The panel has two modes: Operate, for using Fulltrace, and Build, for building it. In Operate I pick a job, see the price before it runs, approve the spend, and watch it work live through to the finished report.
One Hub for the Whole Run Lifecycle
The Work tab gathers workflows, runs, signals, projects and audits into one screen organised around the life of a run. I choose the work, check the price, confirm the spend, and watch it happen live through to the result, without touching a terminal. Watching is always read-only. Anything that acts (launching a run, changing a workflow's default models, warming or evicting a local model, recording a decision against a finding) is a confirmed press, and every one of those acts is recorded.
flowchart LR
    D["Discover
workflow catalogue"] --> C["Configure
choose options
and targets"]
    C --> E["Estimate
cost priced from
run history"]
    E --> L["Launch
explicit spend
confirmation"]
    L --> O["Observe
live runs +
graph view"]
    O --> U["Understand
results and
findings"]

    %% Blueprint tokens as literal hex (Mermaid cannot parse CSS vars or color-mix)
    classDef step fill:#62d99a1f,stroke:#62d99a,stroke-width:1.5px;
    classDef spend fill:#e0be621f,stroke:#e0be62,stroke-width:1.5px;

    class D,C,E,O,U step;
    class L spend;
The screen updates itself every 4 seconds while a job runs, advancing node statuses and moving finished runs from Active to Completed. An idle tick never redraws the page or closes something I have open.
Graph nodes badge whether their newest stage was approved or rejected, not just whether it ran. Finished runs carry their cost, tokens, and models, and by-model donut charts break spend down per model for a workflow or a single run.
Clicking any fan-out node opens its detail: the findings report it produced, a clear passed-or-failed verdict, the models and tokens each stage used, and a jump straight into the Audits view with that target already selected.
The Projects pill draws one card per product with its code targets underneath, derived fresh on every read from the committed registries and the run history. Readiness is a counted checklist (present, absent, or not applicable), never a score, and the only button is Refresh: changing a project stays a hand-reviewed git edit.
Enrol a project starts from a repository folder and an AI tool of my choice. The runner composes a fenced interview prompt and hands it to that tool on my own account, so Fulltrace spends nothing and writes nothing. What comes back is a proposal: the registry entry still lands as a reviewed edit plus a restart.
The Signals pill mines the run records into per-workflow signal: verifier verdicts, decision rates, a week-in-counts card, and a run-over-run view that sorts a project's findings into new, still open, and gone. Deterministic and display-only, with no model anywhere in it. Every number says what it is counted out of and whose decisions it counts, and a store that has never been written says so. It informs what I pick next; it changes nothing on its own.
What Changed Since August
The extension ships a new build most days. These are the changes since August that changed how the panel is used.
A switch above the tab bar picks between using Fulltrace and building it. Operate has eight tabs: Work, Chat, Schedule, Context, Memory, Analytics, Logs, Config. Build has eight: Slices, Register, Build log, UI/UX, Inbox, Gates, Reports, and Ideas, which arrived on 23 September. Nothing is more than two clicks from the top, and the panel reopens where I left it, remembered per project folder.
Pick a model, type, get a reply, without leaving the editor. Every reply says which model answered and what it cost, and a spending cap stops the tab when it is reached. Chat uses its own key: the key that runs audits cannot be read for it. A model already on my machine can answer too, at $0, with the memory and time it took shown instead of a price.
The Schedule tab shows every unattended job and whether it is armed. Arm and Disarm are buttons now, and so are New job, Edit and Edit limits. Every entry is checked by the runtime itself before it is written, and editing a job disarms it until I arm it again, so the tab can never run something other than what I approved.
Config > Governance lists the nineteen standing rules with how each one is enforced: a guard in running code, a test that goes red, a checklist step, or prose that nothing checks. It also counts how many live rows and gates name each rule.
Seven panels show readings of something else: what needs me, what ran, what is enrolled, what is armed, where the slices are, whether the gateway is up, what was spent. Each now shows one line saying where the reading came from, when it was taken, and how it stays current. An empty list gives a count and a reason instead of a blank.
A "Scope of this run" block on the workflow detail sets how deep a code audit reads and how far back changes count. Each project in the picker says when it was last audited, or that it never has been. A run that covers four of nine projects says four of nine, before the launch and in the record afterwards.
Approving a Fix, Without Trusting It
The audit does not just find problems, it offers to fix them, and this is the one place in Fulltrace where an AI can actually change my code. So it is the part I was most careful with. The flow is four steps: review, dry-run, approve, apply, and what makes it safe is what sits between them. I see the exact change first, the project's own build has to accept it before I am even asked, and what I approve is that one specific change, not a standing permission.
Single Poller, Two Surfaces
One StatusPoller polls the gateway's GET /status every 4 seconds and scans the filesystem for skills, commands, memory files, and agents. The sidebar and the full panel both read from that same poller, so the two surfaces never drift out of sync with each other.
Always visible in the VSCode activity bar. Shows server status and uptime, the budget windows and the tool-use counters, and opens Studio. No interaction needed to keep it current: the poller drives updates automatically.
Opens on demand from the activity bar or command palette into the full panel, in whichever mode I left it. It is a passive consumer of the same poller state, so opening it triggers no extra requests. The layout fills the editor window and scrolls within the active tab only; the status card and tab nav stay fixed.
status_poller_scanwhat one poller reads, every 4s
Implementation Notes
The extension runs on only the VSCode extension API, Node's own built-ins (http, child_process, fs), and the TypeScript compiler at dev time only. No npm packages ship at runtime, no bundler: just a VSIX installed via code.cmd --install-extension.
Every colour is a var(--vscode-*) theme token, not a hardcoded hex value, so the webview matches whatever theme the editor is in automatically, and a nonce-based CSP keeps it from running injected script. Each AI client also gets its own distinct, consistent colour across every tab and badge, so a client is recognisable at a glance.
Settings
Every part of the connection is configurable under agentOsDashboard.* in VSCode settings: which host and port the gateway listens on, how often it polls, and which pm2 process the Start/Stop/Restart controls drive. Those controls call pm2 with no shell and a process-name allowlist regex, so the configured name can never break out into an arbitrary command.